

We have received some nice stats and graphs in from Byte Mobile, providing an insight into the network activity it observed during 2010. Some of the highlights Byte observed might be well known by now, but they reveal some good insight all the same – and particularly into how video is impacting the overall data load of the network.
1. The death of the busy hour
Network capacity is under a constant strain throughout the day and evening. With traffic peaks lasting up to 12 hours, so called “busy hours” are a thing of the past.
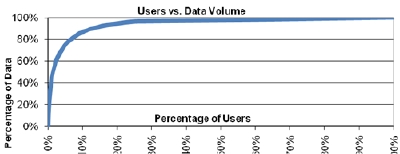
2. The data hog does exist
10% of all mobile data users generate approximately 85% of overall traffic in the network. Touch smartphone subscribers access and view video five times more than non-touch smartphone subscribers.
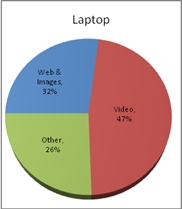
3 Video is the driver, and higher resolutions are set to take that further
Video accounts for 48% of total network traffic, with user-generated content such as YouTube dominating the consumption of network capacity. Today, higher-resolution video is requested a third less often than lower-resolution video yet generates a similar amount of the total data traffic in the network – 31% to 39%. This trend indicates that even a small increase in the number of users consuming higher-quality video will generate a significantly greater network traffic load.
4 Data offload is an option – as is optimisation
Mobile network operators are quickly evolving their networks in order to manage the strain on the radio access network (RAN), backhaul and core. They are employing data offload strategies using small cells and Wi-Fi, upgrading their backhaul, and adding smart capacity utilisation products to improve network efficiency and the delivery of multimedia content and video services.
Byte Mobile’s 2010 Mobile Minute Metrics Highlights
User Behavior
●The peak hours for data traffic in wireless networks are consistent throughout the day and evening.
●The most prevalent type of video on wireless networks worldwide continues to be user-generated content available on YouTube and Google Videos. On average, this content currently accounts for 48% of the total network video traffic.

●Today, higher-resolution video is requested a third less often than lower-resolution video yet generates a similar amount of the total data traffic in the network – 31% to 39%. This trend indicates that even a small increase in the number of users consuming higher-quality video will generate a significantly greater network traffic load.
●10% of all mobile data users generate approximately 85% of overall traffic in the network.
New Class of Mobile Devices
●A new generation of touchscreen mobile devices is driving increased video consumption, and the operators servicing these devices are experiencing significant network changes. This trend indicates that as mobile devices get smarter and the user experience improves, video consumption will continue to rapidly accelerate.
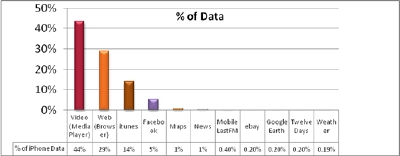
Multimedia Applications are Consuming Wireless Networks
●The mobile applications that consumed the highest amount of network bandwidth in 2010 were Media Player (mobile video), Web Browser (a significant portion being mobile video), iTunes, and Facebook. Media Player, Web Browser and iTunes generate approximately 87% of total data volume in the network. This trend confirms the shift to entertainment-based usage and demonstrates the impact of multimedia applications on wireless networks.