


The FTTH Council Europe commissioned Plum Analysis to find out
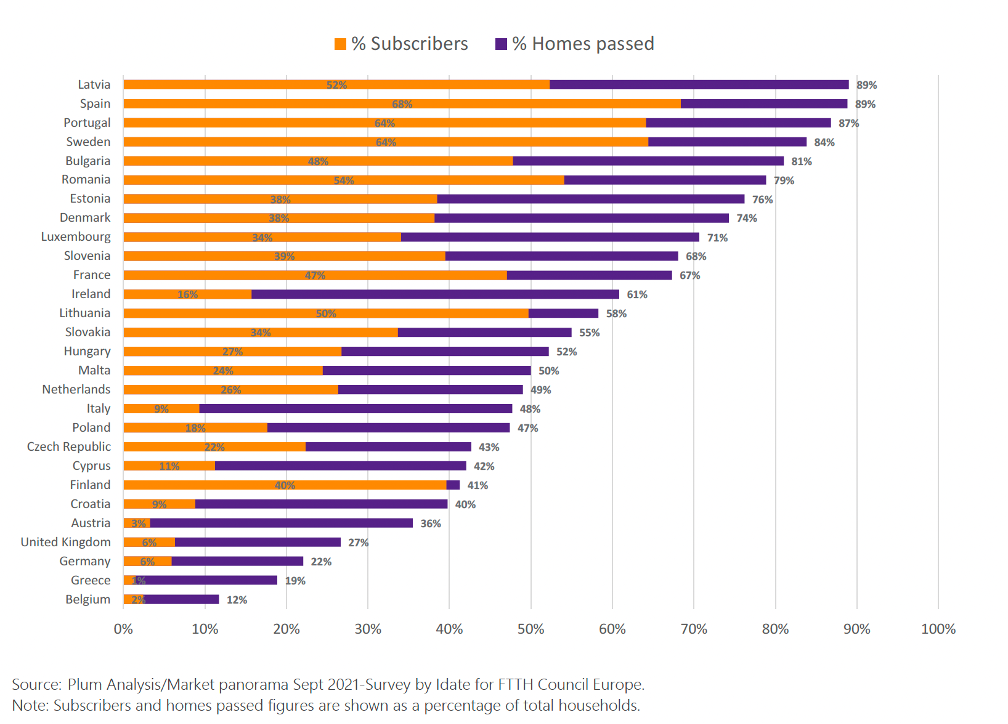
While fibre build-out has accelerated tremendously since the COVID-19 crisis, take-up has not. Take-up is around 50% of homes passed. The FTTH Council Europe wanted to understand how uptake of existing and new FTTH infrastructure could be accelerated.
In particular, it wanted to better understand why take-up in some countries was proportionately much higher than in others and commissioned Plum Analysis to find out. There were a number of surprises arising from the research, including the impact of competitive infrastructure, digital funding and policy.
Plum started with high level quantitative analysis across the European Union countries plus the UK to identify key drivers for fibre adoption. Then drilled down into eight countries it felt highlighted interesting trends and the few demand-side policies deployed in Europe. Plum then drew some conclusions including policies that could make a difference.
As a starting point, it analysed three types of data points in EU countries plus the UK:
• socio-economic factors like income levels, income distribution, poverty rates, GDP, etc;
• digital supply factors such as broadband prices, quality of copper networks, broadband speeds and digital demand; and
• digital literacy, consumer equipment, ownership and broadband usage levels.
Although constrained by the amount of common data across the footprint and publicly available data, this led to some interesting conclusions.
Faster deployment = faster take-up
There is a clear relationship between the speed of deployment and the speed of take-up. It is likely in some instances that high take-up of an initial deployment accelerates further deployment as network operators generate cash flow much faster and find it easier to secure funding and the two feed each other to create a virtuous circle.
Price gap matters
Price sensitivity is a key factor: the bigger the price gap between FTTH and legacy broadband, particularly ADSL and FTTC, the lower the take-up. The same applies if there is a big difference in price between fibre and mobile broadband which results in some customers opting for mobile-only broadband.
However, the study did not find any strong correlation between socio-economic indicators – such as income levels, urban versus rural, income distribution – and measurable impact on fibre adoption.
Plum was also surprised that it could not identify a link between digital literacy and FTTH adoption. There is some correlation between general broadband take-up and digital literacy, but no indication that better digital literacy would increase fibre take-up rather than any other access technology.
Digging deeper
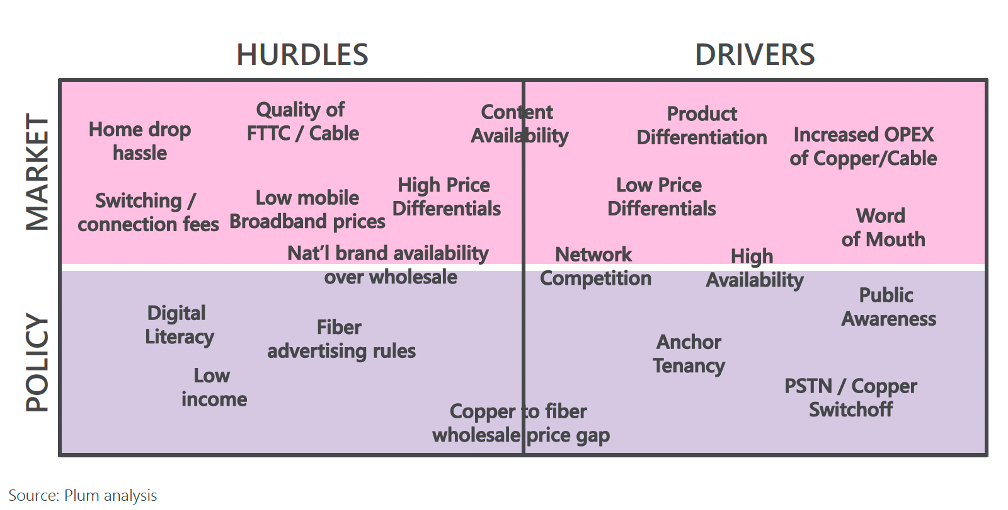
To dig deeper, Plum undertook qualitative analysis of eight countries – Denmark, France, Germany, Italy, Poland, Spain, Sweden and the UK from which it identified a set of drivers and hurdles. It also established that many are within the control of those building and selling FTTH, but governments and policy makers also have strong levers.
Plum built a conceptual analysis framework, shown below, to capture the main hurdles and drivers, and allocate responsibility for them to the market or policy makers.
Getting into the building
The first obstacle is physically connecting customers to the network. In countries with many individual homes, as opposed to multi-tenancy units, there is resistance to holes being drilled in walls, the disruption involved in bringing fibre into the home and connecting it to customer premises equipment. Some countries have addressed this preemptively, others are struggling badly. Resistance is stronger where service providers charge separately for connection. The UK market faces considerable resistance getting into homes.
Italy has a different issue: wholesale service providers that rely on Telecom Italia’s infrastructure to retail broadband are reluctant to pay switching fees to move customers onto its FTTH network, although this would be transparent to customers.
FTTC hangover
Plum found markets that opted for a national policy of FTTC a decade or so ago are finding it harder to get customers to switch to FTTH as FTTC nears the end of its commercial life. This is partly because the difference in performance is not so great as going straight to FTTH from ADSL. Germany, the UK and Italy, and Denmark to a certain extent, took the FTTC route to extend the life of copper infrastructure.
This has been compounded in markets like the UK where regulators did not oblige operators to be sufficiently accurate in advertising higher speed broadband, permitting operators to promote as ‘fibre’ any deployment that involved fibre somewhere. Those who were sold this ‘fibre’ are now confused about why they should switch to fibre when they’ve got it already, and the contrast between FTTC and FTTH is not an immediate, major differentiator.
Cable is factor: in Denmark, where FTTH adoption is relatively high, take up is lower in urban areas where cable is an option. Cable is still key in some markets, depending on who owns gated content, but this is eroding as more content, particularly video, moves online. Some outposts remain, such as Sky in the UK.
Pricing and products
As Plum dug deeper into pricing and product differentiation, it found many service providers are offering a range of fibre packages starting at speeds comparable to those offered by other technologies – so again, what is the incentive for customers to change? Diluting the differentiation between FTTC or cable and FTTH is self-defeating. Editor’s note: customers don’t care about absolute speeds as long as their connection meets their needs.
Digital illiteracy and lack of big brands
While digital illiteracy was not a hurdle overall, Plum found substantial pockets of people held back by it. For example Poland, which is a lower income country among the eight explored in more depth, a significant portion of those in rural communities are not online and this is tied to digital literacy. Likewise in rural Italy, many householders have ADSL and don’t understand fibre options and fear moving to it will be complicated.
Plum also found these aspects are closely linked to brand awareness. In markets like Italy and the UK, where fibre is often offered through wholesale models, the lack of familiar, trusted brands slows adoption.
Competing infrastructure
In markets were FTTH take-up is the highest, many subscribers and potential subscribers have more than one fibre network operators competing for the same customer. Spain is a good example, and to a lesser degree, France. This dynamic was positive in terms of driving adoption, but as these markets have matured, there has been gradual shift from network competition to a wholesale model, particularly in Spain where most operators would rather use someone else’s network than deploy their own.
However, in response to a question from the audience as the event to launch this research, Felten acknowledged, “Even at a regulatory level, there is very little data on overbuilding that is publicly available. So in markets like Spain and France for example, we do not know exactly who connects how many homes and how many of those are competing with other homes.
“There is like anecdotal evidence that network competition drives adoption, but that doesn’t mean that overbuilding itself is the primary factor. There’s also a very real question of if the third overbuilder still benefits from that awareness impact or only the second one? We don’t know.”
Plum thinks network competition is a driver but points out it’s not the only model, as Sweden or Denmark show. Here overbuilding to compete has always been limited although it’s increasing slightly now in Denmark.
The copper connection
Another powerful factor that comes down to of policy is switching off the copper network: once fibre penetration and adoption reaches 60-70%, it becomes viable and Spain, France and Sweden have set dates. Copper switch off is a strong motivation for customers to move to fibre. Other markets are reaching the point of maturity where they can set a switch off date, and Plum suspects that the energy crisis will speed this up as copper infrastructure consumes much more energy than fibre.
Awareness and availability
The last three factors highlighted by Felten combine awareness and availability. High availability of fibre in an area creates awareness among people, and word of mouth recommendation boost awareness including among those within areas of coverage who were oblivious to the fact.
Awareness can be reinforced by local and national governments, but in various markets Plum heard how local governments put much effort into getting fibre infrastructure built but then rarely communicate about it to stimulate adoption.
Demand-side drivers
Plum identified two national voucher programmes in Spain and Italy designed to drive FTTH take-up, and analysed the more ambitious Italian one. It subsidised end-users’ purchases of either new devices or a new broadband subscription. Users mostly chose new devices and only about 20% of beneficiaries chose better broadband subscriptions, and they opted for FTTC. So the investment in subsidies did little to benefit FTTH adoption. The Spanish programme continues, but the one in Italy has been paused to assess the allocation criteria and subsidy models.
There are other demand-side incentives via mechanisms like social tariffs, but these schemes are much more scattered, making it hard to assess their effectiveness. Overall, Plum’s impression is that there are probably better ways of using public money to drive FTTH adoption, but new approaches must be assessed as they arise.
Fragmented fibre platforms
In markets where wholesale is an important way for service providers to offer FTTH, there tends to be a fragmentation of wholesale platforms. Hence if there are 20 wholesale networks in a country without a common means of using them all, service providers can struggle to serve the whole market because it’s hard for them to resell the infrastructure provided by different platforms.
This important issue has been resolved in some markets, like France, but it remains a big issue elsewhere, such as the UK, compounded by resistance to physical connection, as mentioned. Some markets like Spain pre-empted this issue: for the last 25 years, multi-tenanted blocks have been built with vertical ducts to carry fibre – or any cabling – around the building and into each unit.
More wholesale-oriented models, such as in Sweden and Denmark, need to have strong national brands associated with them to be effective. Put it another way, predominantly wholesale models without the participation of the national brands have less successful take-up.
Simple propositions
In short, Plum found the markets where the national broadband plans were put in place early with easy to understand offers have been the most successful, such as Spain, France, Sweden and Denmark. This allowed market participants to invest with a degree of confidence and boosted deployment and adoption.
In other markets, like Germany, Italy and the UK, the model fluctuated, which apparently slowed market development. Even so, it’s possible to overcome this handicap, as Benoit Felten, Director at Plum Analysis, commented, “…some service providers are not doing a very good job at marketing their offers, at differentiating their pricing, their services, their features [and] their customer experience at the moment of installation might not be optimal.
“Those players that get all of these things right, absolutely overperformed the market. One clear example of this is for example Fibrus in the UK [which] has significantly higher take-up than a lot of the other altnets because they understand what they’re doing and they’re executing on it.”
The full report can be downloaded from here, free of charge.